


Want more on Virginia’s population trends? We’ve collected all our demographic coverage in one place.
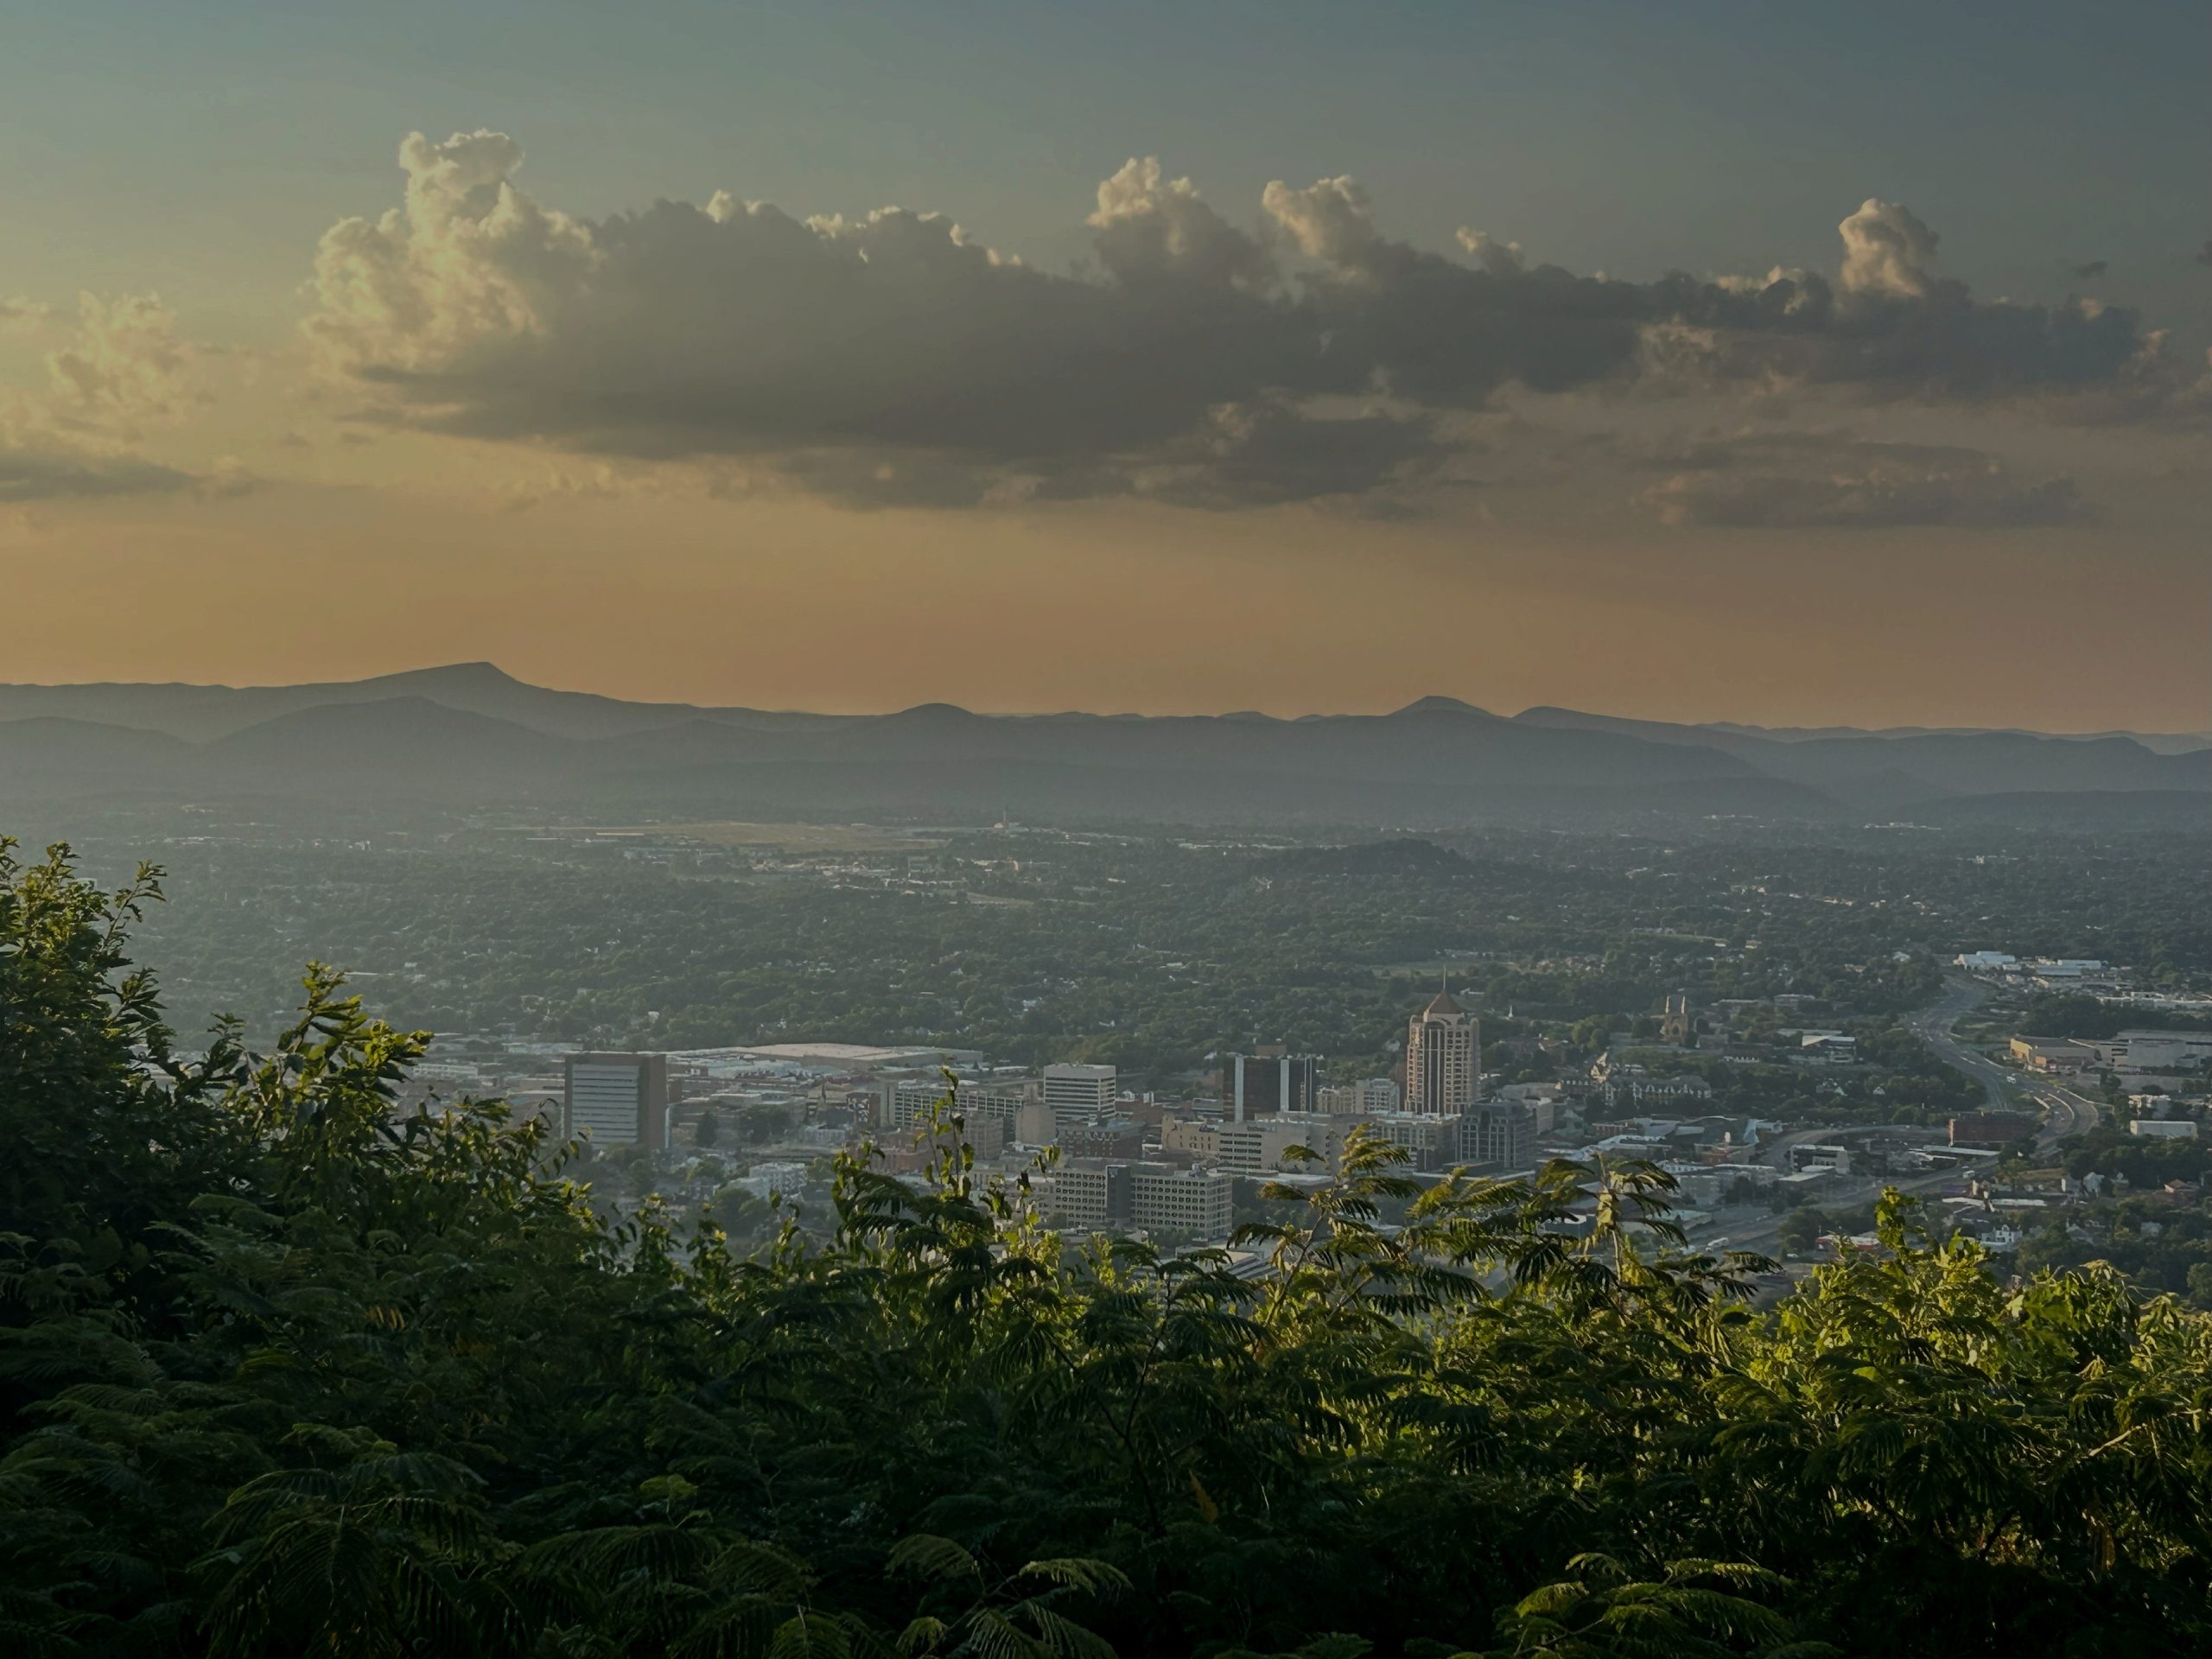
If you think the candidates for governor and other statewide offices this year spent less time in the western part of the state than they once did, you’re right.
If you want to know why, just look at this map. This shows how the state’s center of population has changed since 1940, when it was in Cumberland County, somewhere along U.S. 60 in or near Bear Lake State Park.

Through the ’40s and ’50s, the population center lurched eastward, pulled by population growth in what we call today “the urban crescent” from Northern Virginia to Richmond to Hampton Roads. Starting in the 1970s, the population hung a hard left — some might say it’s done so politically, as well — and moved inexorably north due to population growth in Northern Virginia. Today it’s in Caroline County, more or less along Interstate 95, somewhere between Ladysmith and the Spotsylvania County line. By 2030, it should be right on the county line and then keep moving north toward Fredericksburg, much like traffic in a slow-moving traffic jam on the interstate.
This map, which comes courtesy of demographer Hamilton Lombard at the Weldon Cooper Center for Public Service at the University of Virginia, reveals several population trends in the state. The first, as we’ve seen, is how the state’s population growth in the urban crescent generally and Northern Virginia in particular has pulled the population center first eastward and then northward. The second is how that Northern Virginia growth is now slowing after a big burst in the early 2000s.
Let’s just pause and absorb the implications of this map.
Those of us in the western part of the state often feel disconnected from our state government in Richmond. I’m fond of showing off this map, prepared by Brian Brettschneider, a mapping hobbyist in Alaska, that shows how much of Southwest (and parts of Southside) Virginia is closer to other state capitals than our own. In the most extreme case, the Ewing neighborhood of western Lee County is closer to nine other state capitals than Richmond.

In some ways, though, measuring distances from Richmond isn’t the best gauge of disconnection. Perhaps we really ought to be measuring the distance from that population center in Caroline County — which would put Southwest and Southside even farther away from the center that really matters. We use Richmond as shorthand for the state’s power center, but what happens in the state capital merely reflects the larger dynamics that are reshaping Virginia. Years ago, when I was young and naive, I thought Roanoke was a good base from which to observe state politics because it was roughly in the physical center of the state. (“Roughly” is the key word there. As Virginians surely know, the true geographic center of the state is in Buckingham County, about 2 miles south of Mount Rush.) Nowadays, if you want to be at the center of the action, perhaps we should be in Caroline County. Or, if we want to think ahead, Fredericksburg.


This explains why Abigail Spanberger, then the Democratic candidate for governor, didn’t make any public appearances in Roanoke between mid-June and late September — and why Winsome Earle-Sears, the Republican candidate for governor, didn’t have any public appearances in Roanoke over the summer before having some in September. Even Roanoke, the largest metro in the western part of Virginia, is a long way from where most of the state’s voters are. My quest this year was to have all the statewide candidates visit Lee County, our westernmost county. (Spanberger , Earle-Sears and Attorney General Jason Miyares made the trip; no others did). Lee County really is on the edge of the map, in more ways than one. I will continue to trumpet the interests of Southwest and Southside as loudly as I can, but this map of the state’s shifting population center is the real map that matters — and with each move north, we matter a little bit less.
This map made me wonder about what other localities would be considered the “center” of Virginia in other ways. If we want to determine the income center of the state, we’d weight everyone with their income and see where we’d have to put the map to balance it. Given the affluence of Northern Virginia, and the poverty in parts of Southwest and Southside, that “income center” would likely be much farther north than the population center.
I haven’t seen anyone do that math, but the Brookings Institution has a study that computes the gross domestic product of every metro area in the country and what percentage of their state’s GDP they account for. Their figures for Virginia:
Northern Virginia: 45.7%
Hampton Roads 16.9%
Richmond 15.9%
Roanoke 3.0%
Charlottesville 2.5%
Lynchburg 1.9%
Harrisonburg 1.5%
New River Valley 1.3%
Winchester 1.3%
Staunton 1.0%
Bristol 0.7%
Remainder 8.3%
If a governor — any governor — appears to give more time and attention to Northern Virginia than the western part of the state, there’s a solid economic reason for that. The Northern Virginia metro is 15 times more economically important to the state than the Roanoke metro area, 24 times more economically important than the Lynchburg metro and so on. The center of the state’s economy probably isn’t that much different than the population center.
There are other ways to look at things, particularly if we set aside trying to balance a map and just look at which localities come closest to matching the state’s median in different measures.
Income: Virginia Beach is our median example
Virginia’s median household income is $90,974, according to the Census Bureau. The locality that comes closest to matching that figure is Virginia Beach, at $90,685. Income-wise, it’s the center of the state. Everything in Southwest and Southside comes in well under that median, with Roanoke County the highest at $82,931 and Norton the lowest at $38,497.
Race: Virginia Beach most closely matches the state’s profile
How about the demographic center of Virginia in terms of race? Race is a complicated construct — Hispanic is not a race, it’s an ethnicity. Racially, 18.7% of Virginia’s population is Black. The locality closest to that percentage? Once again, Virginia Beach — 18.9%. By this measure, Southwest Virginia is very atypical. West of the Roanoke Valley (which people in Southwest Virginia would not claim as truly being Southwest), the locality with the highest Black population is Radford at 9.3%. Three counties in the western part of the state — Carroll, Craig and Highland — have Black populations that are less than 1% of their overall population. Southwest Virginia really doesn’t look much like the rest of the state in many ways.
Ethnicity: Falls Church is the best replica of the state
Now let’s look at ethnicity. The Census Bureau says that 10.7% of Virginia’s population is Hispanic. By that standard, the locality that’s most typical is Falls Church, which is also 10.7% Hispanic. The highest is Manassas Park City at 45.9%; the lowest are Highland County and Norton, at 0%. Every locality in Southwest and Southside comes in under the average except one: Galax at 15.8%.
Education: Hanover County and Virginia Beach are the most typical
In Virginia, 41.5% of adults 25 and older have a college degree. The two localities that come closest are our old friend Virginia Beach (40.4%) and Hanover County (42.4%). Virtually all of Southwest and Southside comes in under that. We do have an unusual number of colleges and those communities help skew things. The state’s overall scale runs from Falls Church (79.7% of adults have a college degree) down to Covington (9.6%)
Politics: The best bellwethers vary but are on the eastern side of the state
Prince Edward County is the state’s best bellwether. It’s voted for the winning candidate for governor in every election since 1969, and before that you have to go back to 1893 to find a year where Prince Edward voted on the losing side. However, the margins in Prince Edward don’t necessarily reflect the margins statewide.
To find the localities most reflective of the vote share overall is harder because the pendulum swings back and forth. The presidential year of 2024 was a Democratic year in Virginia, although not so Democratic as usual — Kamala Harris took 51.83% of the vote statewide to 46.05% for Donald Trump. The locality that came the closest to being a bellwether was Sussex County, where 51.82% voted for Harris.
Brunswick County 53. 98%
Chesterfield County 53.59%
Northampton County: 52.55%
James City County: 52.16%
State: 51.83%
Sussex County: 51.82%
Chesapeake: 51.09%
Virginia Beach: 50.45%
Montgomery County: 50.06%
By contrast, the gubernatorial year of 2021 was a Republican year and Glenn Youngkin won with 50.06% of the vote. That year the locality that came closest to matching his vote was Northampton County.
James City County: 52.5%
Chesapeake 52.4%
Montgomery County: 52.0%
Chesterfield County: 51.8%
State: 50.6%
Northampton County: 50.3%
Surry County: 50.0%
Hopewell: 49.3%
This year, Abigail Spanberger won with 57.36% of the vote. The locality she most closely matched was Charles City County:
Chesterfield County 58.25%
State: 57.36%
Charles City County 57.28%
Greensville County 57.00%
Montgomery County 56.85%
Brunswick County 56.25%
Chesapeake 55.94%
Stafford County 55.74%
Virginia Beach 55.51%
Northampton County 55.24%
James City County 55.21%
The ones that show up in all three elections as being close to the statewide result: Chesapeake, Chesterfield County, James City County, Montgomery County and Northampton County.
In none of these do counties in Southwest show up, with the exception of Montgomery County — which is an atypical county by Southwest standards but is much more typical by state ones.
My point to all of this: If people in Southwest and Southside feel increasingly estranged from the rest of the state, these are some of the reasons why.